workshop
Utilizing Random Forest Algorithm and Bayesian Spatio-temporal model to monitor SDG #3 progress through eliminating Malaria
Introduction
The United Nation’s third sustainable development goal is good health and well-being. In order to reach this goal with no person left behind, it is imperative to focus on malaria, a serious disease impacting people in lower-middle income countries worldwide. The disease is caused by the parasite, Plasmodium Falciparum, which is transmitted to humans through night-biting Anopheles mosquitoes. Although there are medications to treat malaria, the drugs are usually not an effective treatment against the parasite. In fact, chloroquine, a malaria drug, has developed resistance to P. Falciparum [1]. Furthermore, the illness is most prevalent in less developed countries, such as in the region of Sub-Saharan Africa, where access to treatment is not available. Malaria is most prevalent in non-urban areas, especially in underdeveloped villages. Since Africa has a hospital-centered healthcare system that mostly serves urbanized areas, infected individuals in these villages receive no proper treatment [2]. Moreover, “60% of malaria deaths worldwide occur in the poorest 20% of the population [3].” With no access to hospitalization, many residents of malaria-prone regions, especially children and pregnant women, suffer from the severe symptoms, like fever, seizures, bleeding, etc. Additionally, malaria has placed huge financial burdens on the families and governments of these countries. Ultimately, malaria is a deadly disease. Since curing malaria is a difficult task, prevention is of the utmost importance.
One gap I’ve identified through my research on malaria is that malaria risk and prevalence is often assessed and quantified primarily through analyzing one data set. For example, “Housing improvements and Malaria Risk in Sub-Saharan Africa: A multi-country analysis of Survey Data”, used conditional logistic regression and chi-square tests to determine the malaria risk based on housing quality [4]. This study quantified malaria risk solely based on architectural data. However, there are various factors and covariates that should be taken into consideration when quantifying malaria risk and prevalence, for increased precision and accuracy. What is a thorough and proper metric to represent malaria risk in localized regions in Africa, that conveys information on multiple datasets including topography, climate, urbanization, insecticide-bed net use, etc? My research question falls under the category of a descriptive inquiry, since I aim to solely assess the malaria situation in various regions of Africa, and describe the profiles of different locations using a quantifiable variable. My research question is based on simply monitoring the current state of the disease in these regions, which will aid in SDG progress. Some sub-questions include: What is the malaria risk in localized regions of Africa, based on various factors that contribute to malaria prevalence? Are these factors from datasets equally weighted in their contribution to the disease? What are some other covariate datasets that should be included to assess risk?
Through my previous research, the two data science methods of Random Forest and Bayesian Statistical Model seem promising.
Method 1: Random Forest
The first data science method to be considered is the classification algorithm, Random Forest. Random Forest works through creating multiple “decision trees”, with each “branch” of the tree representing a possible decision/reaction.
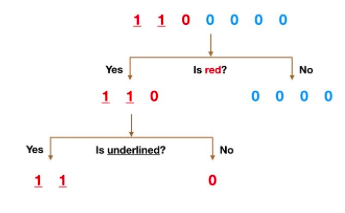
Above, is a simple diagram depicting one decision tree. The tree works to make a prediction through “answering” a series of questions.
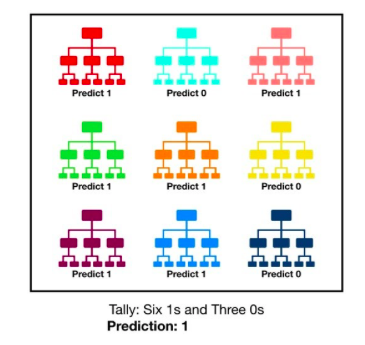
In the algorithm, there are various, uncorrelated trees operating like a committee, to produce a final output result [5]. Essentially, the trees work together like an ensemble, while each individual tree produces a prediction. “The [prediction]… with the most votes becomes our model’s prediction .” The simple diagram above shows various decision trees, each producing their own prediction. The result of the entire committee is dependent on which prediction had the most “votes”.
The random forest method was used in association to malaria in the article, “Integrating Rapid Risk Mapping and mobile phone call record data for strategic malaria elimination planning [6].” At the time this article was published in 2014, it was understood that in order to fully achieve elimination, countries must move away from universal prevention actions to focus more on targeted treatment attacks. The authors argued that infection prevalence is a poor metric to combat the disease, as it is not specific enough to local regions. They argue that a surveillance system is required – one that would utilize malaria transmission information to design proper elimination practices. For example, the Haitian government attempted to eliminate malaria in the 1960s through mass drug administration and DDT- spraying. However, this time-consuming and costly treatment plan failed since the mobile population kept introducing the parasite into regions that had just been cleared. Thus, knowledge of human movement within a malaria-endemic country can be useful for identifying the best plan of action to avoid resurgence of the parasite. This study analyzed billions of call detail records (CDRs), which provided data on human movement between regions in Namibia, a malaria-endemic country in Africa, to map “source” and “sink” areas (net infection export/import locations). CDRs were provided by a leading mobile phone service provider in Namibia, Mobile Telecommunications Limited (MTC), for a 12-month period. “The regression tree classification approach ‘Random Forest’ was applied [along with an]R package ModelMap to model the risk of [malaria] cases occurring in each 250×250 m grid cell… to undertake mapping across the whole of northern Namibia (Tatem 2013).” For example, to predict the probability of cases appearing, decision trees first divided data based upon elevation. Next, it divided data based upon levels of vegetation. The data was continuously split, to make a final prediction of risk. Other data included for splitting in the algorithm include- “spatial covariate datasets representing rainfall, temperature, elevation, temperature suitability for Plasmodium falciparum, topographic wetness, vegetation, land cover, distance to water, infrastructure, and population density at 250 m resolution.” The fitted model of risk was then applied to a 250 m spatial resolution gridded dataset to produce the final product of a case-risk map across Northern Namibia.
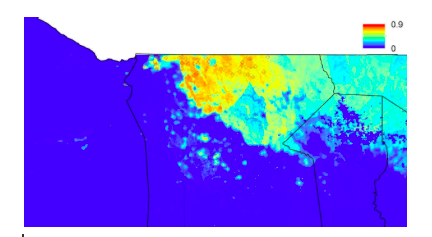
Above, is one of four maps of probability of future malaria cases produced using random forest. It is of the Omusati region in Northern Namibia.
One way model quality was assessed was through area under the curve (AUC) on graphs and correlation statistics. A higher AUC indicates the model was better at predicting, and that the model could accurately discriminate between factors and their relationship to malaria probability. (ex: Could the random forest model discriminate accurately between vegetation of type A or type B, and which has higher association with malaria?) A strong model performance was indicated through an AUC = .96.
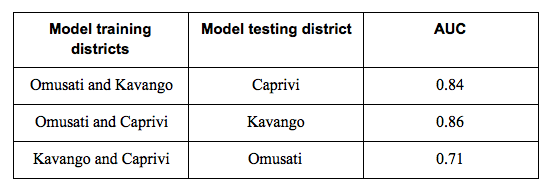
The table above displays that random forest was used based on case data from 2 districts, and then the model was used to predict malaria probability in the third district. The AUC values are generally high, which indicates strong performance and reveals that the driving factors of malaria probability are similar among the three districts.
Method 2: Bayesian Spatio- temporal Model
The second data science method is the Bayesian Spatio-temporal model. “ Bayesian statistics is a mathematical procedure that applies probabilities to statistical problems. It provides people the tools to update their beliefs in the evidence of new data [10]” The article, “Bayesian Statistics Explained to Beginners in simple english”, provided an excellent example [8]. The article talks about how 2 players, James and Niki, are competing in a championship race. Niki has won 3 times while James has 1 once. Any ordinary model would predict that Niki would win again on the next race date. However, Bayesian statistical models would take into consideration the fact that it rained when James won, and it will rain again on the next race date. Essentially, the model takes into consideration important conditions and calculated conditional probabilities.
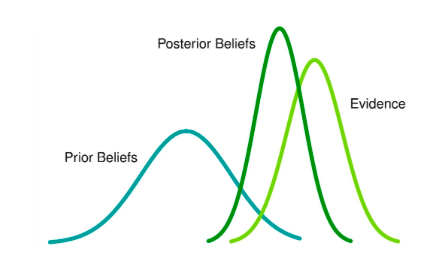
From the image above, it is clear to see that Bayesian models take into account prior beliefs and combine them with new information, or posterior beliefs. Lastly, evidence is included. For this reason, Bayesian models are critical in producing predictions about the future.
In the article, “Spatio-temporal analysis of malaria vector density from baseline through intervention in a high transmission setting [7],” mosquito densities carrying the parasite P. Falciparium were estimated using the Bayesian spatio-temporal model based on various climatic and ecological variables, and also through sampling some households within the region. Specifically, the effect of indoor spraying was assessed on mosquito density in Eastern Uganda. 100 households were randomly selected to be sampled, and CDC light traps were established. Various covariates were assembled to model mosquito densities: rainfall, temperature, vegetation index, elevation, night-time lights, distance to water sources, etc. Finally, a bayesian model was used to predict vector densities incorporating the covariates.

The above formula is used to calculate the outcome of mean vector density per household per night. The first term represents random effects; the second term represents several covariates; the third term takes into account the season; and the last term takes into account the spatial and temporal effect. Additional things to note is that i represents household location and j represents month.
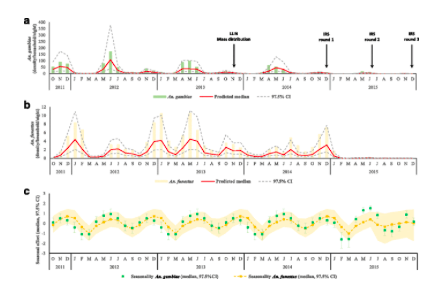
The above figure shows the predicted vector densities before indoor residual spraying, and after residual spraying, using the Bayesian Spatio-temporal model. Thus, the study shows that there are major reductions in malaria vectors when indoor residual spraying was introduced into the community, even with all the different ecological and climatic variables. The results suggest that spraying should be introduced in different communities, even where the environment is a little different. Another interesting finding of the study is that rainfall increased vector densities. Ultimately, the model produced is beneficial for making decisions about when to administer the treatment of spraying.
Discussion
Ultimately, both Random Forest and Bayesian Spatio-temporal models are important data science methods that can be utilized in monitoring SDG progress of good health and well-being, through monitoring progress of eliminating malaria in lower-middle income countries. The methods are different from one another, but they could work complementary to one another to help solve the research question: What is a thorough and proper metric to represent malaria risk in localized regions in Africa, that conveys information on multiple datasets including topography, climate, urbanization, insecticide-bed net use, etc? The Bayesian Statistical model did a great job at assessing which variables and covariates impacted malaria risk/prevalence more than others. The model was good at analyzing exactly what impact each covariate had on mosquito density, and the extent of the impact. For example, it was found within the study that distance to water had a protective effect on the households and that there was a 10.6% decrease in adult vector abundance for every kilometer increase in the distance to a water body. Meanwhile, the study on random forest did an excellent job at utilizing all these datasets and factors to ultimately produce a quantifiable number of malaria probability. Together, the two methods could work together as the Bayesian spatio-temporal model could determine which covariates are important to consider in certain regions compared to others, and then the Random Forest algorithm could use those covariates to produce probability of malaria cases. The two could work hand-in-hand to produce values of probability of malaria cases to smaller and more localized regions than previously considered, since the Bayesian-statistical model could utilize localized samples to determine the important covariates to be considered in that geographic location. In conclusion, the two methods could help solve the gap in the research which is that too few datasets are being used to assess malaria prevalence and risk. The two methods make sure that enough covariates are being utilized, but specifically only the critical covariates that will provide a preciser and more accurate measure of malaria risk and prevalence.
References
| [1] Sanchez, J. D. (n.d.). | Malaria: General information. Retrieved from https://www.paho.org/hq/index.php?option=com_content&view=article&id=2573:general-information-malaria&Itemid=2060&lang=fr |
[2] Dechambenoit, Gilbert. “Access to Health Care in Sub-Saharan Africa.” Surgical Neurology International, vol. 7, no. 1, 2016, p. 108., doi:10.4103/2152-7806.196631.
[3] Suh, K. N., Kain, K. C., & Keystone, J. S. (2004). Malaria. Canadian Medical Association Journal , 170(11), 1693–1702. doi: 10.1503/cmaj.1030418
[4] Tusting, L. S., Bottomley, C., Gibson, H., Kleinschmidt, I., Tatum, A. J., Lindsay, S. W., & Gething, P. W. (2017). Housing Improvements and Malaria Risk in Sub-Saharan Africa: A Multi-Country Analysis of Survey Data. PLoS Med, 14(2). doi: https://doi.org/10.1371/journal.pmed.1002234
[5] Yiu, Tony. Understanding Random Forest. 12 June 2019, towardsdatascience.com/understanding-random-forest-58381e0602d2.
[6] Tatem, A. J., Huang, Z., Narib, C., Kumar, U., Kandula, D., Pindolia, D. K., … Lourenço, C. (2014). Integrating rapid risk mapping and mobile phone call record data for strategic malaria elimination planning. Malaria Journal, 13(1). doi: 10.1186/1475-2875-13-52
[7] Alegana, V. A., Kigozi, S. P., Nankabirwa, J., Arinaitwe, E., Kigozi, R., Mawejje, H., . . . Tatem, A. J. (2016). Spatio-temporal analysis of malaria vector density from baseline through intervention in a high transmission setting. Parasites & Vectors, 9(1). doi:10.1186/s13071-016-1917-3
[8] Bayesian Statistics Explained in Simple English For Beginners. (n.d.). Retrieved April 19, 2020, from https://www.analyticsvidhya.com/blog/2016/06/bayesian-statistics-beginners-simple-english/